Income Development of Outpatient Clinics (2018 - 2022)
Graphs 1 and 2 also show that the impact of the coronavirus pandemic on outpatient clinics was reflected in only a moderate increase in doctors' "gross wages" and clinic profitability in 2020. This was likely due to a decline in services and patient visits, resulting in lower revenues from health insurance companies. However, in the following two years, there was a return to strong wage and profit growth in the outpatient sector. It appears that this segment of healthcare emerged financially stronger from the COVID-19 crisis. Further research should explore the extent to which direct payments from patients contributed to this, as outpatient clinics' own revenues have surpassed the growth of insurance payments, with their share of total revenues gradually increasing. A key question for future research is whether clinics have become accustomed to charging patients as a significant source of income.
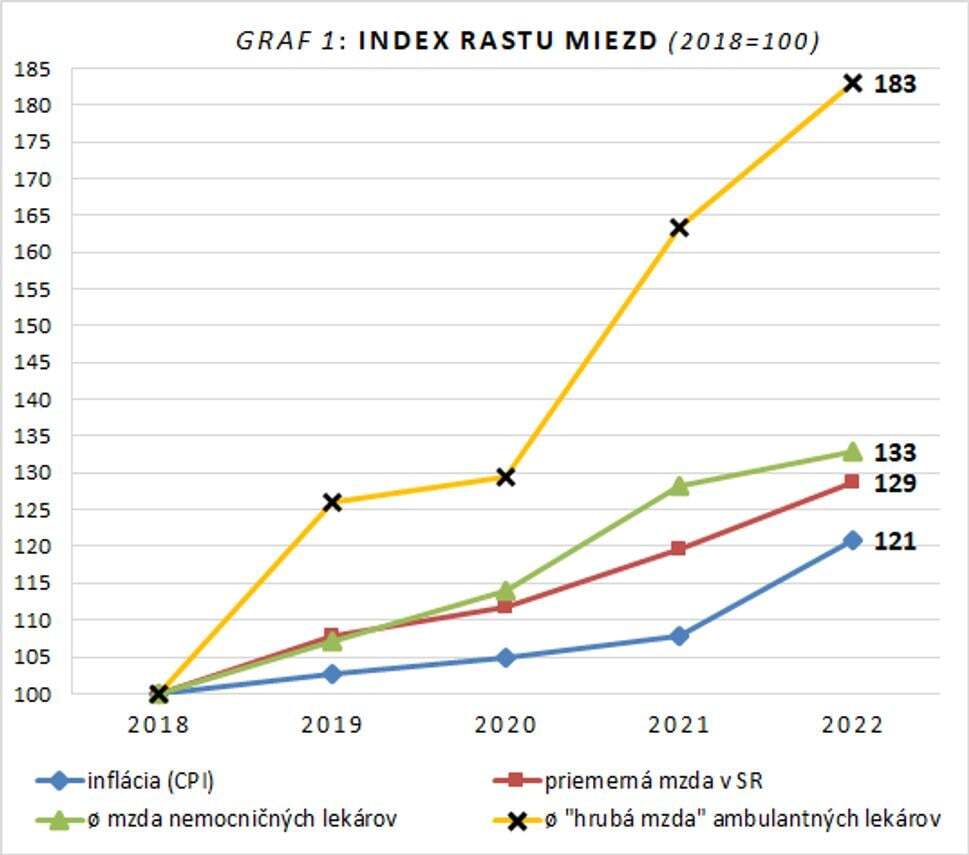
Data sources: Register of Financial Statements, Ministry of Finance of the Slovak Republic; Health Insurance Companies; Statistical Office of the Slovak Republic; National Health Information Center (NCZI); Trade Union of Health and Social Services (SOZ ZaSS).
Calculations and graph: INEKO
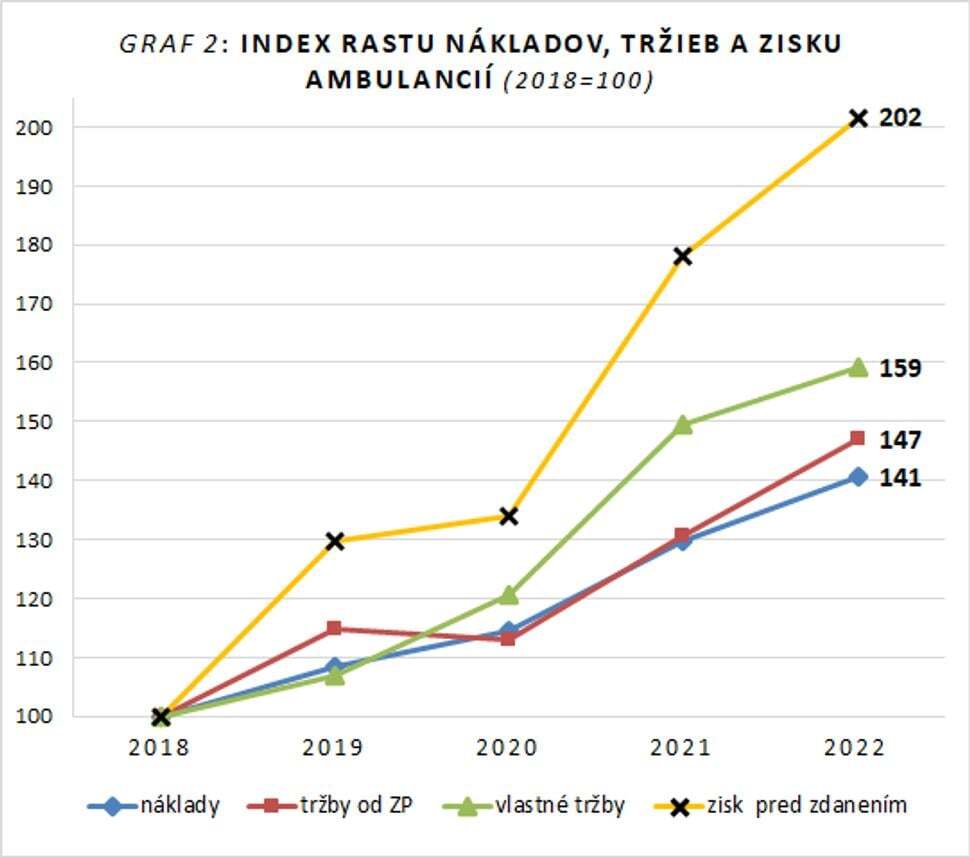
Data sources: Register of Financial Statements, Ministry of Finance of the Slovak Republic; Health Insurance Companies (ZP); Statistical Office of the Slovak Republic (ŠÚ SR); National Health Information Center (NCZI).
Calculations and graph: INEKO
Box 1: Concept of "Gross Salary" for Outpatient Doctors in Brief
The vast majority of doctors in outpatient clinics not operated by hospitals work in non-state (private) clinics, which are typically structured as business entities (e.g., limited liability companies or joint-stock companies), meaning they are legal entities and business enterprises aimed at generating profit. Most of these doctors own their clinics, and their total declared income consists of the "actual" gross salary paid, which, along with the nurse's gross salary, forms part of the personnel costs reported in the clinic's financial statements, as well as paid dividends or profit shares.
Earnings of Outpatient Doctors by Specialization
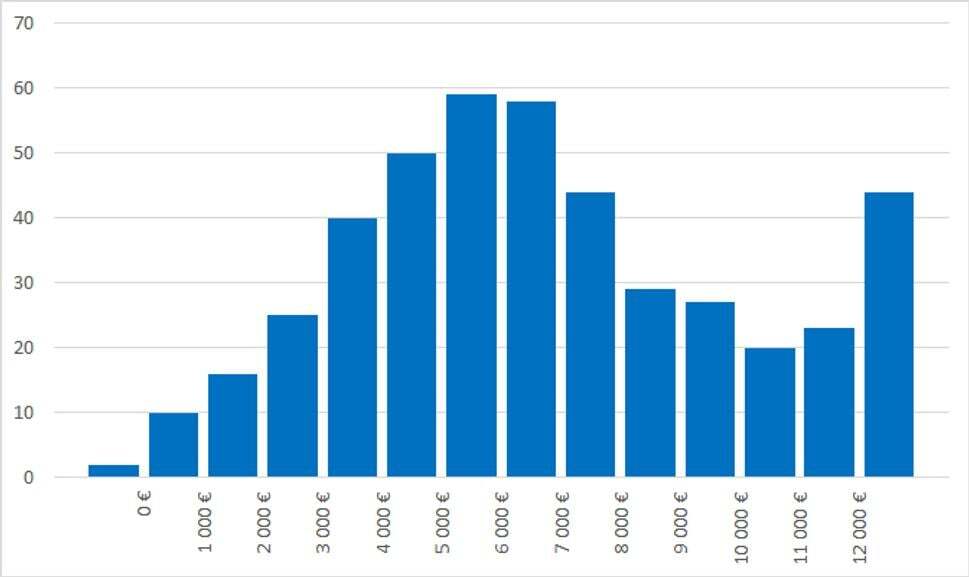
Graphs 3 to 10 (histograms) depict the distribution of outpatient clinics according to the income interval – the interval of monthly "gross salary" corresponding to their doctors' earnings.
(n = 3,511 non-state outpatient providers – legal entities; year 2022; "gross salary" recalculated for one full-time medical position)
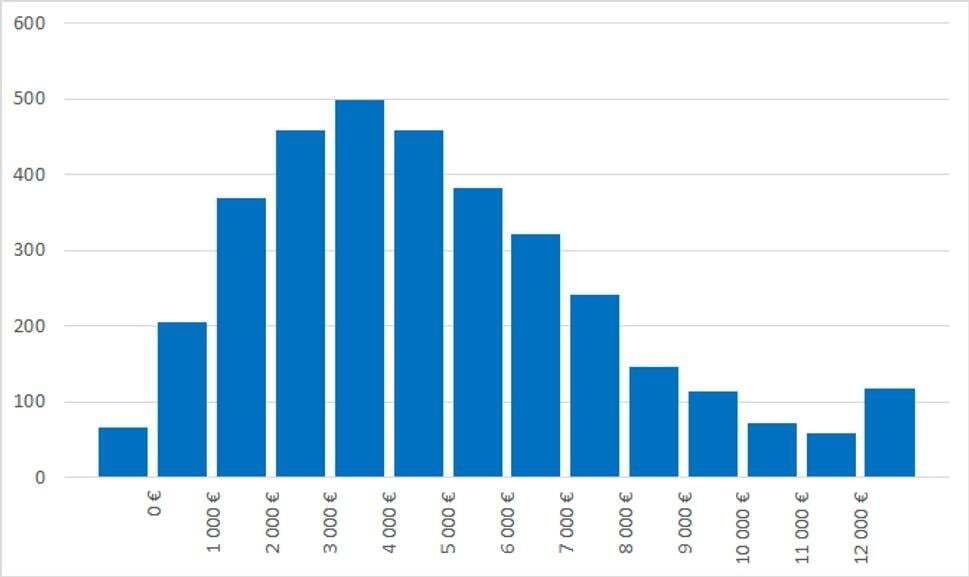
Data Sources (including the following histograms): Register of Financial Statements, Ministry of Finance of the Slovak Republic (MF SR); health insurance companies; Statistical Office of the Slovak Republic (ŠÚ SR); National Health Information Center (NCZI)
Calculations and graph: INEKO
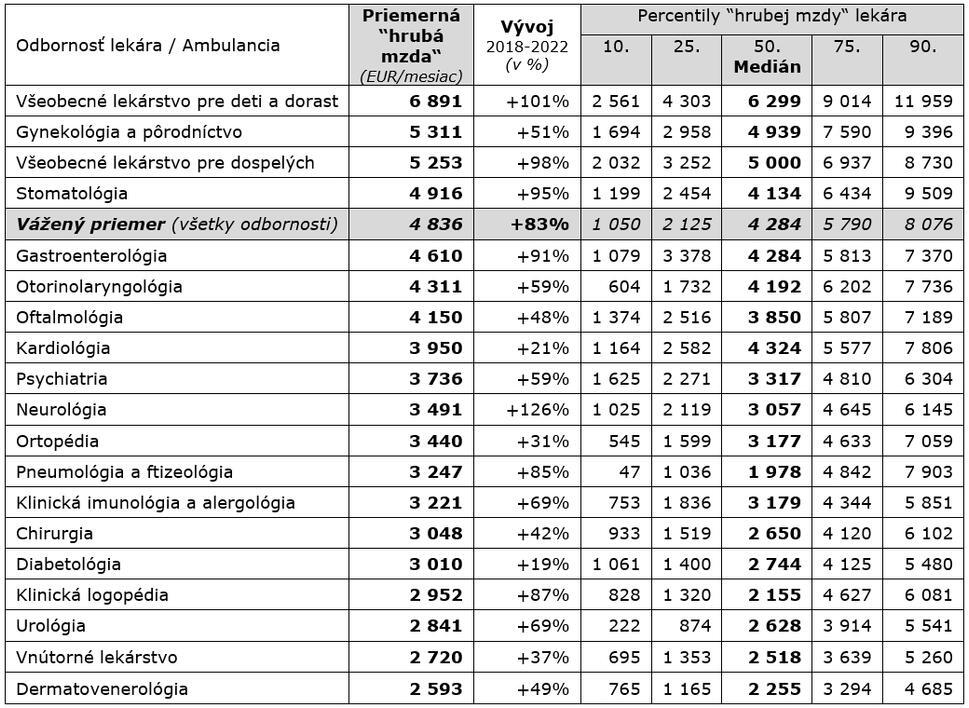
We found that significant differences in the incomes of doctors across various non-state outpatient practices continue to persist when comparing the 19 most common medical specialties. The difference between the highest-earning outpatient pediatricians and the lowest-earning outpatient dermatovenerologists (dermatologists) was identified as being as much as 2.7 times.
The following Table 1 shows the most common medical specialties in the outpatient sector, ranked by the amount of the average monthly "gross salary" of doctors, recalculated for one full-time position. The table also illustrates the development of this value over time – by comparing the years 2018 and 2022. The other columns present the distribution of doctors' "gross salary" in various specialties according to percentiles.
Table 1: "Gross Salary" of Doctors, Its Development, and Distribution by Income Percentiles in 19 Most Common Medical Specialties
(n=3,511 non-state outpatient providers – legal entities; data for the year 2022; monthly "gross salary" in euros recalculated for one full-time medical position; for multi-year comparison purposes, the "Development" column analyzes a sample of n=4,017 practices)
Data Sources: Register of Financial Statements, Ministry of Finance of the Slovak Republic (MF SR); health insurance companies; Statistical Office of the Slovak Republic (ŠÚ SR); National Health Information Center (NCZI)
Calculations and table: INEKO
We hope that this information resonates with young medical students who are choosing which specialty to study, as it is no longer true that general practice is not financially lucrative. Notably, outpatient pediatricians are lacking in many regions of Slovakia, including the Bratislava region. Financially, being a general practitioner pays off!
From Graph 4 below, we can see that for the given interval sizes (in thousand euros), the largest number of pediatric practices have doctors earning a gross monthly income in the range of 5,000 to 6,000 euros, followed by the second most common interval of 6,000 to 7,000 euros. It is also notable that a relatively high percentage (10%) of pediatric practices fall into the highest (open-ended) income interval of over 12,000 euros. As shown in Graph 5, for general practitioners for adults, in 142 monitored practices, doctors earn a gross monthly salary in the range of 3,000 to 4,000 euros.
Graph 4: General Practitioners for Children and Adolescents Practices ("gross salary"; 2022)
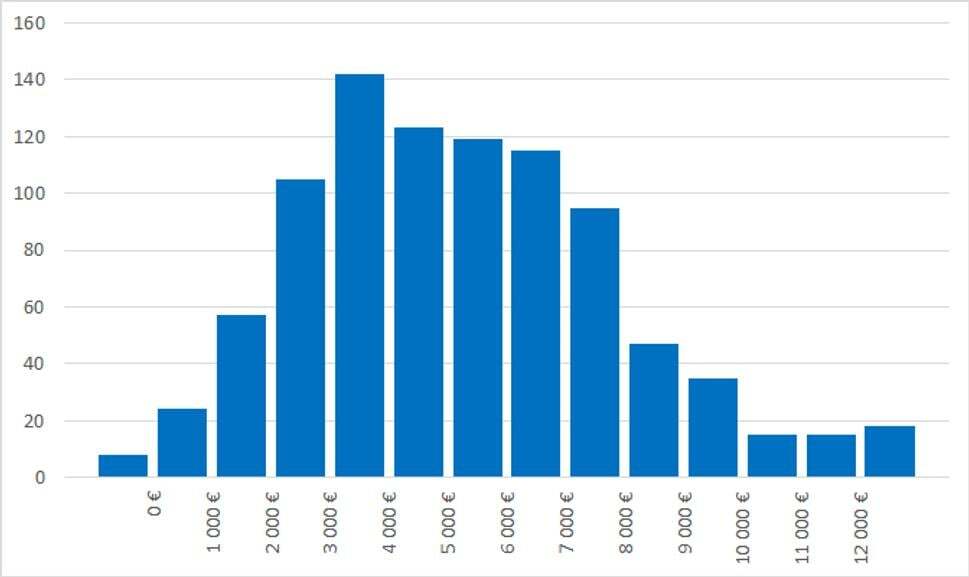
Graph 6: Outpatient Clinics of Gynecologists ("gross salary"; 2022)
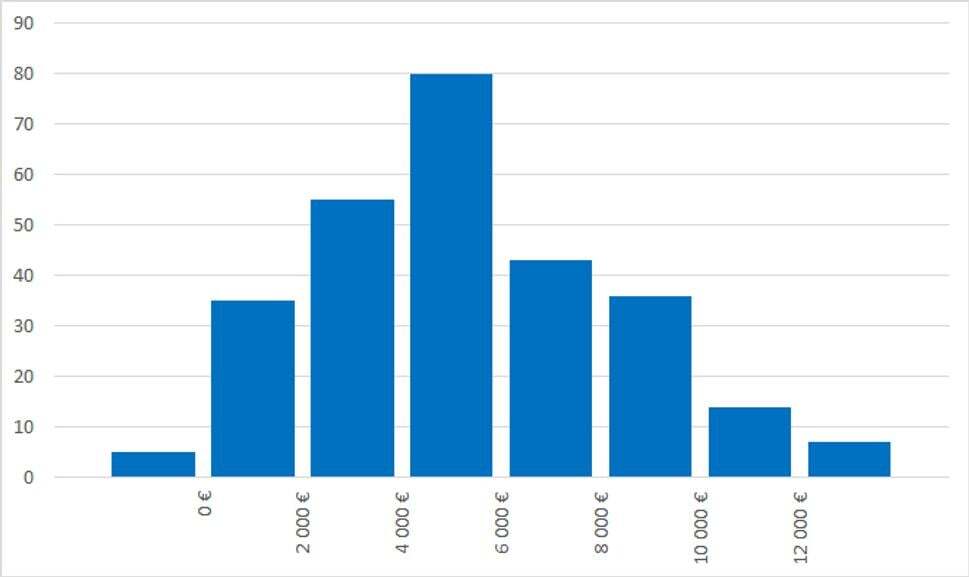
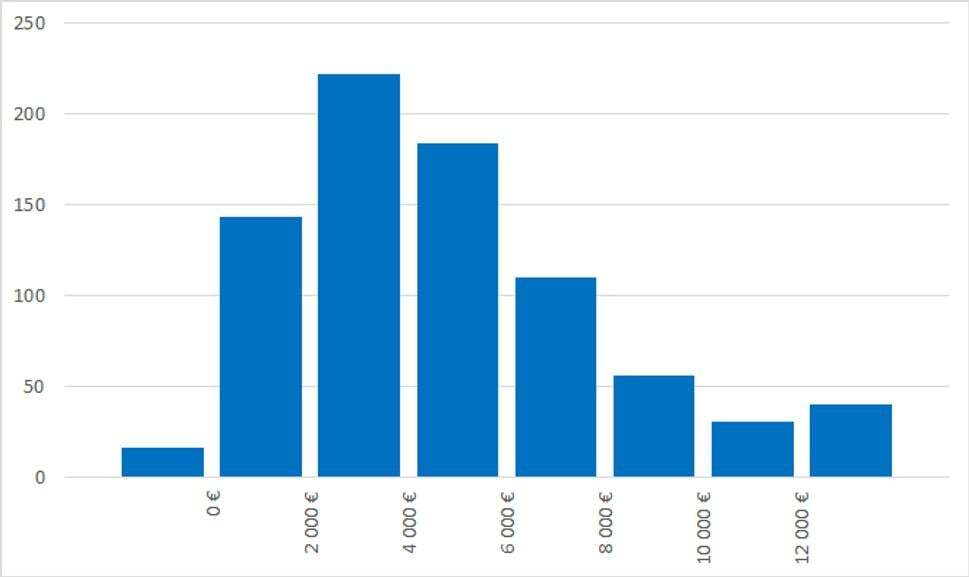
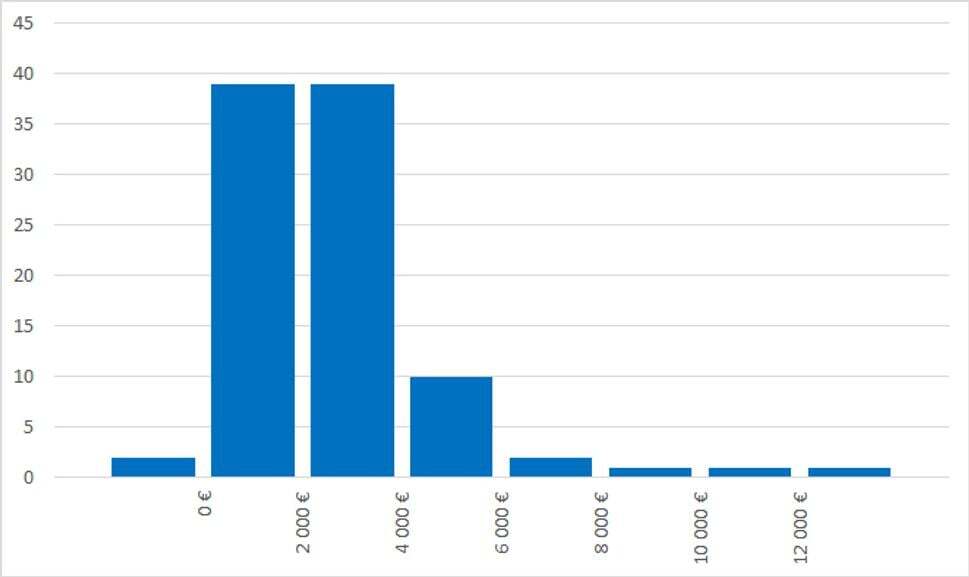
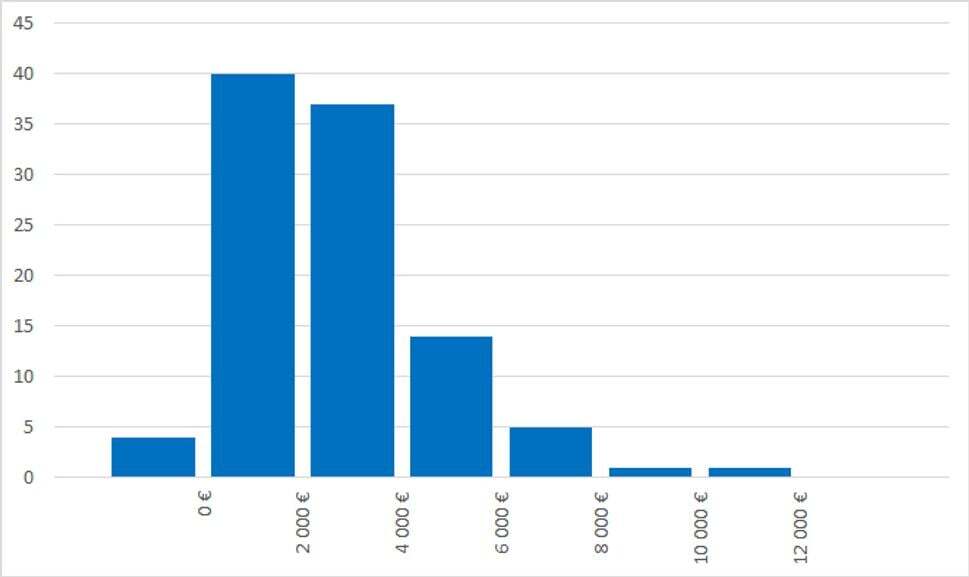
Interestingly, in the analysis of the previous period (2014-2017), doctors in purely neurological outpatient clinics belonged to the specialty with the lowest "gross salary" in 2017 (1,418 euros). When comparing the previous observed period of 2014-2017 with the current period of 2018-2022, we find that neurologists saw the largest percentage increase in income from health insurance companies, second only to gastroenterologists. This resulted in a rise in the income rankings for outpatient neurologists, and between 2018 and 2022, they became the leaders in the growth of "gross salary" and pre-tax profit, which increased by 126% and 148%, respectively (see Tables 1 and 3).
Graph 10: Neurology Outpatient Clinics ("gross salary"; 2022)
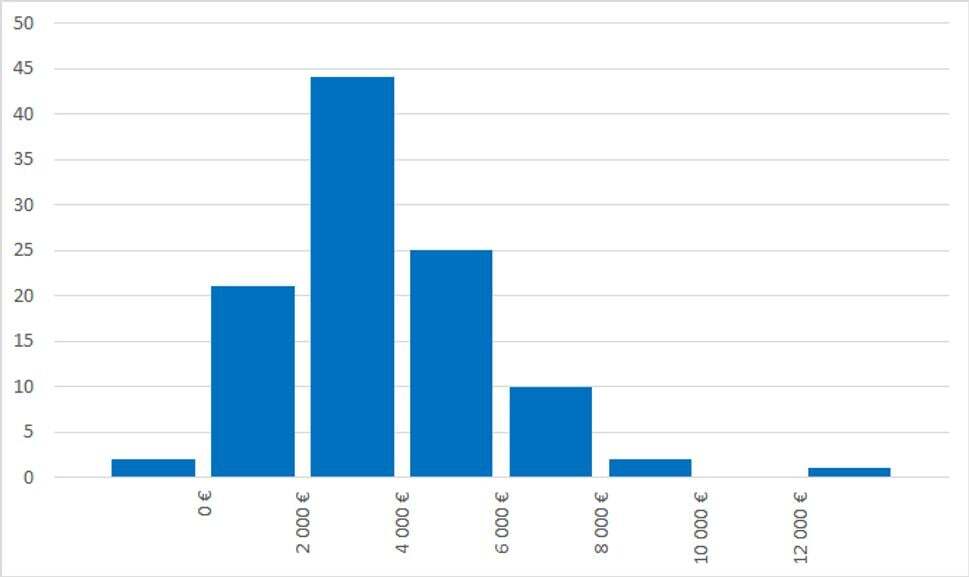
Own revenues of outpatient clinics
Table 2: Share of Own Revenues in Total Revenues of Outpatient Clinics in 2022
(n = 3,511 outpatient clinics)
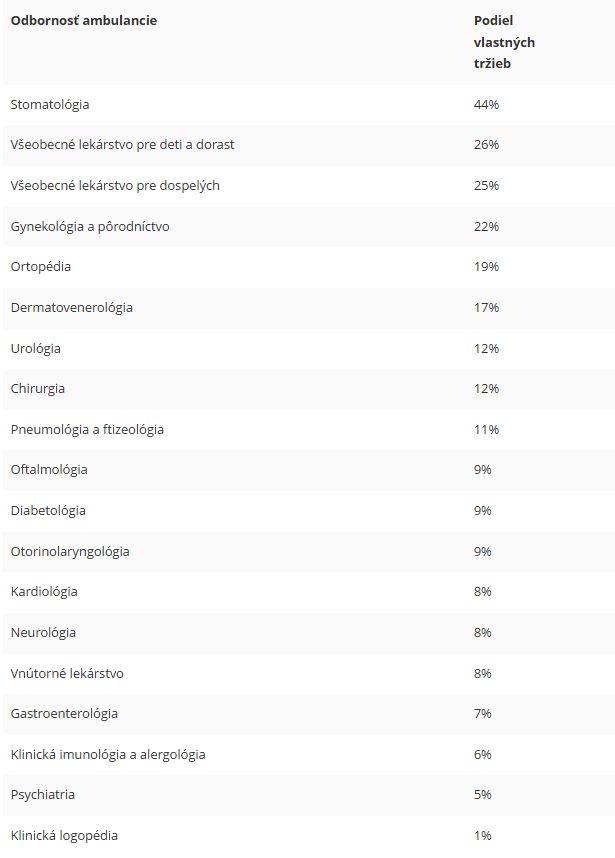
Data Sources: Register of Financial Statements, Ministry of Finance of the Slovak Republic (MF SR); health insurance companies
Calculations and table: INEKO
Expences, Revenues, and Profitability of Outpatient Clinics
Regarding annual expences per full-time medical position, the specialties with the highest costs are logically those that require much more advanced equipment for their operations. These include dentistry, gynecology, and gastroenterology. To cover higher depreciation and other costs, they also require higher revenues.
On the other hand, speech therapists, who don't even need to employ a nurse, can manage with significantly lower revenues as their costs are also the lowest. Specialties with the lowest costs and revenues include internists and psychiatrists.
Generally, outpatient providers, who are private business entities, have been consistently profitable as their revenues exceed their costs. The analyzed clinics in 2022, on average, generated a positive financial result (before tax) of nearly 41,000 euros per full-time medical position, with the highest profits ranging from 43,000 to 63,500 euros reported by pediatric clinics, gynecologists, gastroenterologists, ENT specialists, and general practitioners for adults. The lowest profits were generated by dermatologists and clinical speech therapists. See Table 3.
The highest net profit margin, i.e., the profitability of revenues (profit after tax divided by revenues) exceeding 30.5%, was achieved by general pediatricians in 2022. After pediatricians came ENT doctors, general practitioners for adults, and gynecologists. The average net profit margin across all examined specialties was a high value of 21.5%. The least profitable were dermatologists in 2022 (though still with a respectable value of 12%).
The average operating marg, or EBITDA margin (profit before tax + depreciation / revenues), reached almost 34% in 2022 for the analyzed sample of private outpatient providers. The highest EBITDA was recorded by general pediatricians (43.6%). Data has shown that both net profit margin and operating margin have been steadily increasing in our non-state outpatient sector.
Table 3: Financial Results of Outpatient Clinics in 2022 Recalculated per Full-Time Medical Position and Its Development
(n=4,017 outpatient clinics)

Data Sources: Register of Financial Statements, Ministry of Finance of the Slovak Republic; health insurance companies
Calculations and table: INEKO
Revenue of Outpatient Clinics from Health Insurance Companies
Table 4: Average annual payment from health insurance companies for outpatient clinics in different specialties in 2022, calculated per full-time medical position
(n=4,017 outpatient clinics)

Data Source: Health insurance companies VšZP, Dôvera, Union
Table and calculation: INEKO
Box 2: Objective of the analysis
There Are Significant Income Differences Among Outpatient Providers (INEKO, 2019)
Box 3: Methodology of the analysis
After statistical data cleaning and exclusion of extreme cases (outliers), we worked with data from 3,511 entities (for 2022) or 4,017 entities when comparing current data with 2018, representing 44% or 50% of all contracted outpatient providers – legal entities in the observed medical specialties, and 36% or 42% of all outpatient providers, including those operating as sole proprietors.
We sourced data on revenues, costs, and financial results from the income statements of individual providers listed in the Register of Financial Statements. To calculate the equivalent of gross salary ("gross salary") per full-time medical position, we used data from all three health insurance companies on the number of medical positions in outpatient clinics and in individual specialties. We also used information from health insurance companies on the amount of payments to individual outpatient clinics by specialty in our calculations.
Data on the average gross salaries of hospital doctors were sourced from the informational bulletins of the Slovak Trade Union of Health and Social Services (SOZ ZaSS), and the ratio of hospital doctors with and without specialization (certification) was obtained from the Ministry of Health of the Slovak Republic.
Additionally, in our calculations, we used data from the Slovak Health Yearbook from the National Health Information Center (NCZI) on the number of nurses working in outpatient clinics by specialty. For data on inflation trends (Consumer Price Index (CPI)), average nominal wages of employees in the Slovak economy, and the calculation of nurse labor costs, we referred to publications by the Statistical Office (ŠÚ) of the Slovak Republic.
There are no data on the salaries of nurses in the private outpatient sector; therefore, we used the figure from the Slovak Statistical Yearbook for all nurses (including hospital and "social" nurses). In 2022, according to the structure of earnings survey, the average gross monthly wage of a nurse in Slovakia was €1,239 (this value proved to be very similar to the average gross wage of nurses working in outpatient clinics (€1,349), which came from a survey (n=268 participating outpatient clinics) conducted for us by the Association of Outpatient Providers (ZAP) among its members, for which we are very grateful). We assumed that in specialties with relatively higher profits, nurse salaries would also be slightly higher than in less profitable ones, and we adjusted the average wage costs of nurses by specialty in our model based on this assumption.
The "gross salary" of an outpatient doctor, regardless of whether they own the clinic or are merely employed there, was calculated, simply put, as the sum of the doctor's gross salary (after deducting the nurse's salary from personnel costs) and the clinic's profit converted to gross salary (see more about the concept of "gross salary" in Box 1). The "gross salary," as well as other data on financial results, revenues, costs, etc., were calculated and are presented in the tables and graphs per full-time medical position.
This analysis does not take into account undeclared income (fees and gifts from patients without a receipt) or expenses (such as "topping up" a nurse's salary off the books) when calculating outpatient doctors' incomes. The analysis also does not filter out the effect of potential tax optimization through overstatement of costs (depreciation) or the use of company assets for personal consumption.
Dušan Zachar, INEKO
Peter Klátik, INEKO
We would like to express our sincere thanks to the health insurance companies Všeobecná zdravotná poisťovňa, Dôvera, and Union for providing statistical data for the analysis.
INEKO is conducting a healthcare project supported by the health insurance companies Dôvera and Union, and the company Msquare.Donors do not interfere with the outputs of the INEKO institute.
Your support in our work would greatly help us continue contributing to the improvement of public discussion through data. Thank you!
It should be noted, however, that the calculation of the growth dynamics of average gross wages for hospital doctors does not account for the wage growth rate exclusively for certified hospital doctors, i.e., those with specialization, who are comparable in terms of education level to outpatient doctors (since such data are not available). Instead, it also includes the wage growth of less well-paid non-certified hospital doctors, for whom we assume a slightly lower wage growth rate than for certified hospital doctors. In 2022, the average gross wage for hospital doctors (both certified and non-certified combined) in state, regional, and semi-public institutional facilities reached €3,601. Based on knowledge of the base salaries of certified and non-certified hospital doctors, their percentage representation in hospitals, and simplified assumptions about the distribution of additional components of the total gross wage (those above the tariff level), we calculated that the average gross wage (with all bonuses) for a certified hospital doctor could have reached €4,480 in 2022.
A significant jump in hospital doctors' wages occurred at the beginning of 2023, when the more expensive wage formula ("struck deal") with higher coefficients and taking into account years of service began to be applied. Therefore, in the next period, the average wage of a certified hospital doctor will likely once again surpass the average income of a private outpatient doctor. In the third quarter of 2023, the combined average gross wage for hospital doctors (both certified and non-certified combined) reached €4,516.
We tracked four main cost components: personnel costs, service costs, material consumption, and depreciation, which together make up approximately 95% of the total costs of outpatient clinics.
The analysis did not cover outpatient clinics affiliated with hospitals, nor, for methodological reasons, outpatient clinics combining multiple specialties (such as cardiology-internal medicine clinics, etc.).
The specialty of physiatrics, balneology, and therapeutic rehabilitation, which is among the top 20 most common specialties, is not included in the analysis due to methodological reasons.
Interpretation of percentiles, e.g., in the case of general pediatricians: 10% of outpatient pediatricians earned less than €2,561 per month in 2022, 10% earned more than €11,959, and 80% of pediatricians had a monthly income ranging from €2,561 to €11,959. Exactly half of all pediatricians earned less than €6,299, and exactly half earned more than €6,299. 25% of pediatricians earned less than €4,303, and 75% of general pediatricians had a total gross income above this amount in 2022.
This text is a translation of an article from the blog.sme.sk website.
The original text belongs to INEKO, and the translation was done with care for foreign doctors by Sofiia Zayka.
